How to measure the efficiency of creativity in advertising in 5 steps?
Measuring the efficiency of creativity in advertising has historically been challenging. It is hard to isolate the impact of creativity from other factors that impact performance, such as execution tactics or brand health. As the advertising landscape evolves, with brands using several creatives at once and with more and better data, it has become increasingly important to understand the impact of creativity...
Ekimetrics conducted a study providing a technical Marketing Mix Modelling (MMM) approach (object detection algorithms and multi-stage econometric modelling) that demonstrates an objective approach to creative measurement. Here is an illustrated executive summary of the methodology used to measure the efficiency of creativity in advertising.
To know more about Ekimetrics’ methodology, read these articles on:
- How to use pre-trained Detectron2 models to detect brand-specific object in creative images
- How to train Detectron2 models to detect brand-specific object in creative images
- 6 pitfalls to avoid vs. 4 key paths to success when measuring the efficiency of creativity in advertising
One methodology, many different audiences and use cases
The study relies on Meta, focuses on Meta creatives and uses AI to look at 3 billion impressions of nearly 23,000 individual creative images across three and a half years with 124 models. It encompasses multi-stage econometric modelling and Object/text Detection. We used a sample of five brands from the Insurance, Cosmetics, Hospitality and automotive sectors, and 13 related outcome KPIs. We noticed patterns in the features that drive creativity and a higher return on investment. We also spotted the irrelevant features.
With the methodology used in this study, marketers can answer questions such as: “how can marketing returns be improved through creative execution?”. On the other hand, marketing effectiveness professionals can answer questions such as: “how can we codify the creative elements of marketing campaigns?”, “how can I improve measurement when varied creatives are used simultaneously?”.
The methodology can be applied as a whole, or to answer questions relating to Object Detection (OD), like sponsorship content detection, product placement or MMM Sub-Modelling of Meta or other activity. Indeed, MMM Methodology can be adapted for other investigations into Meta activity, such as creative type, creative placement, format, caption/messaging in creative, etc. The same methodology can also be applied to other social media platforms like YouTube or TikTok.
A 5-step approach: Data, Feature & Object Selection, Object Detection, Feature Engineering and MMM
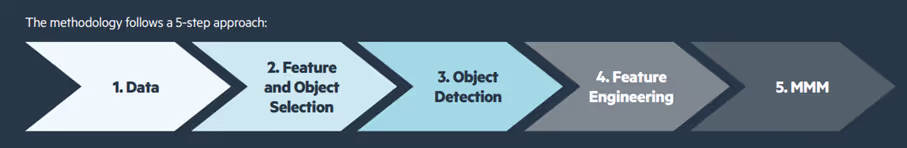
The creative elements of a campaign are defined by features. Features are objects or sets of objects present in the marketing creative, all of which are identified by object detection algorithms. This includes common objects like people, as well as brand-specific objects, such as a logo or product. Each creative is then codified according to the set of objects, allowing for the creation of time series variables that can be modelled through MMM.
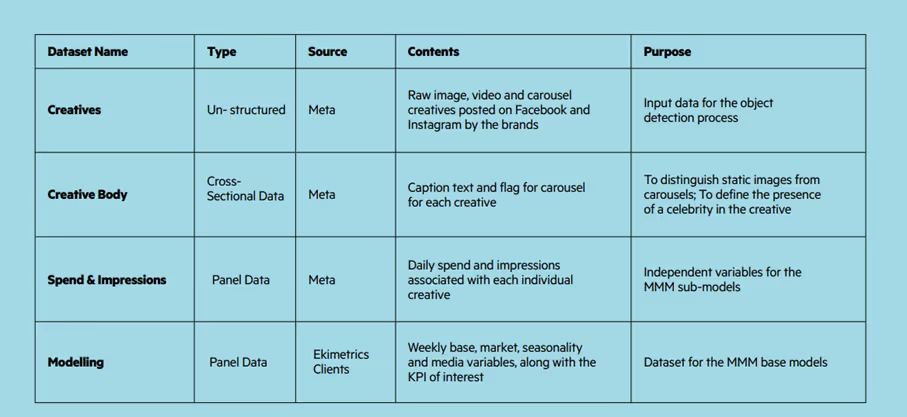
Step 1: Data
Sufficient and relevant data must be gathered for each brand, whereby the impressions in the MMM models match the impressions in the creative data.
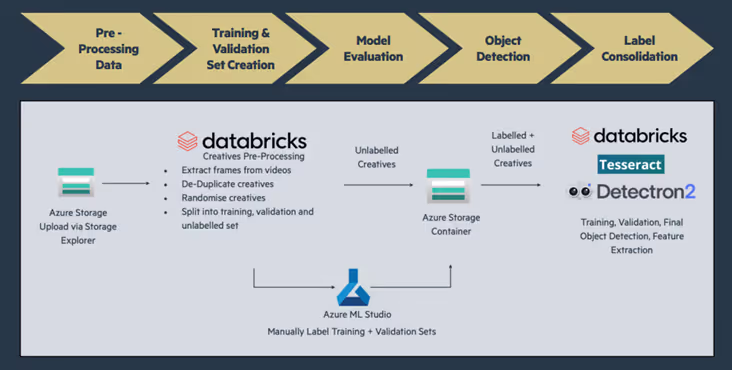
If your coverage is above 100%, you probably have duplicated creatives. The Convolutional Neural Network (CNN) method from the Python library imagededup is efficient at de-duplicating data. Different creative types can be used; in this analysis we used Static, Carousel and Video creatives. Video creatives must be pre-processed. Every 10th frame from videos was extracted, resulting in between 30,000 and 90,000 image files for each brand. All the Data pre-processing was done in Databricks.
Step 2: Feature & Object Selection
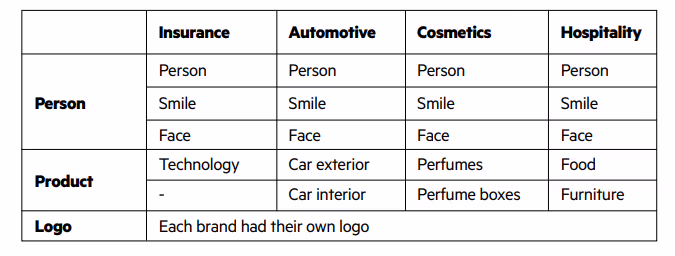
The objects used to encompass the creative elements across the four brands are summarized in the table below.
Feature selection
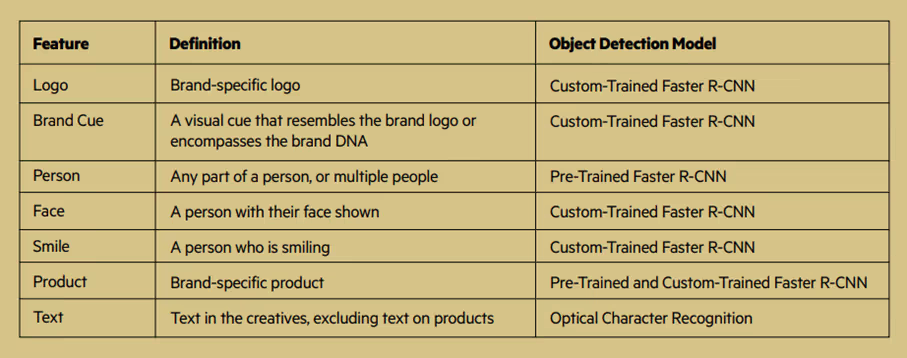
*R-CNN = region-based Convolutional Neural Network
The objective of the selection process is that the features are meaningful to customers, that these appear in creatives from different brands and that these are available in the data. Feasibility and frequency of appearance is crucial.
After determining the broad categories of objects to include in the study, a more involved process was followed for defining the exact objects to be identified.
Objects identified by feature and brand
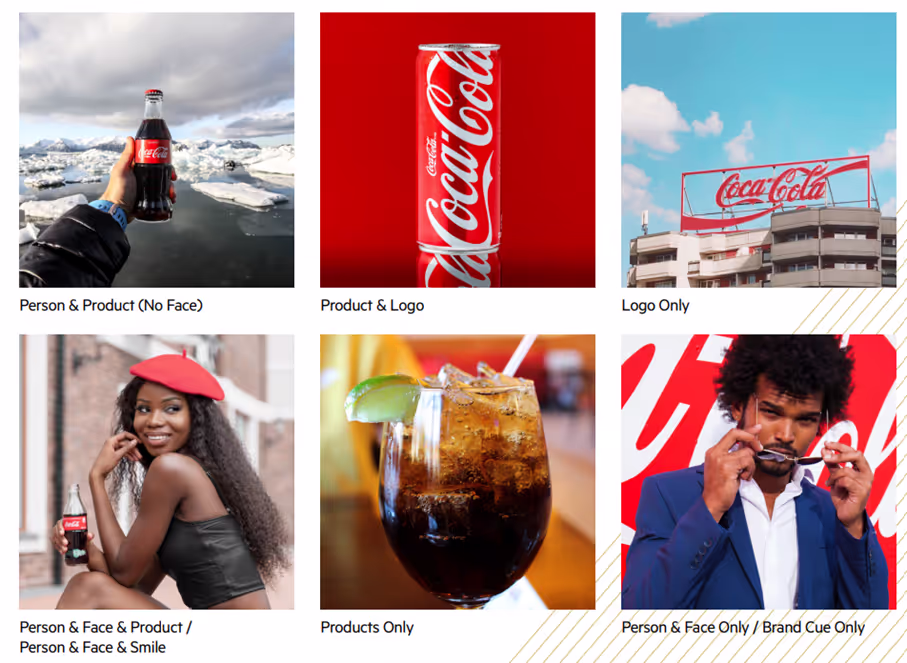
Example: Images and Associated Features
Step 3: Object Detection (OD)
The object detection process relied on a combination of pre-trained and custom trained models from two Python libraries: Tesseract and Detectron2.
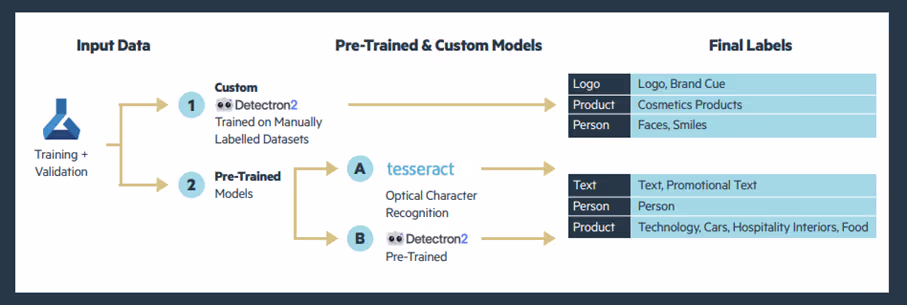
Tesseract, an open-source Optical Character Recognition (OCR) library, was used for detecting text, while Detectron2, Meta AI Research’s next-generation platform for object detection and segmentation, was used for the remaining objects. From Detectron2, pre-trained object detection models were used for detecting common objects such as people, cars, and technology, while custom-trained models were used for detecting brand-specific objects such as logos.
The Object Detection workflow is explained below:
This figure outlines the objects detected by each model type:
Step 4: Feature Engineering
During the feature engineering step, the panel data, which would serve as the independent variables for the sub-models in the marketing mix models, is created.
That is, a dataset containing the total sum of impressions and spend associated with each object per day per brand. While only the impressions data was required for the modelling, the spend was used for deriving the ROIs and thus was also needed at an object level. Due to the significant overlap in objects appearing in creatives, e.g. many creatives contained both Logo and Product, using this dataset in the submodels would lead to a poor model performance and would not allow for meaningful insight into the effect of each individual object. Therefore, a separate sub-model was run for each object (feature) or combination of objects.
For example, Logo was modelled separately from Product. By doing this, each object had an associated contribution which could be directly compared to that of other objects. In order to do this, each object variable also had to have a partnering variable which captured the impressions not associated to that object, so that the effect of including the object could be compared with the effect of not including it. This was done for each of the objects detected (see the figure: Creation of logo features & partnering features)
Distribution of impressions for feature by brand
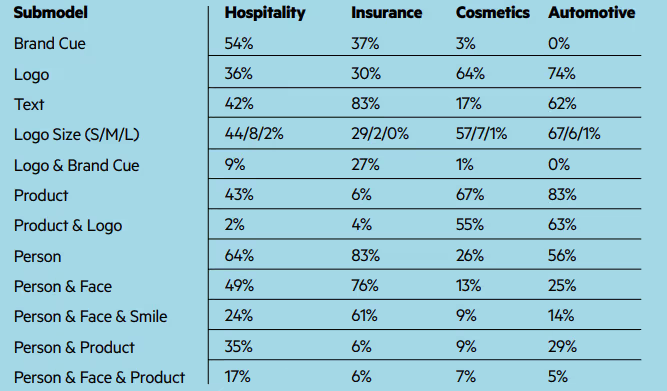
For example, for the Hospitality brand, 54% of the Meta impressions across all the creatives feature a Brand Cue. The percentages sum to more than 100% because an impression can be linked to creatives containing more than one feature.
Creation of logo features & partnering features
Step 5: MMM process
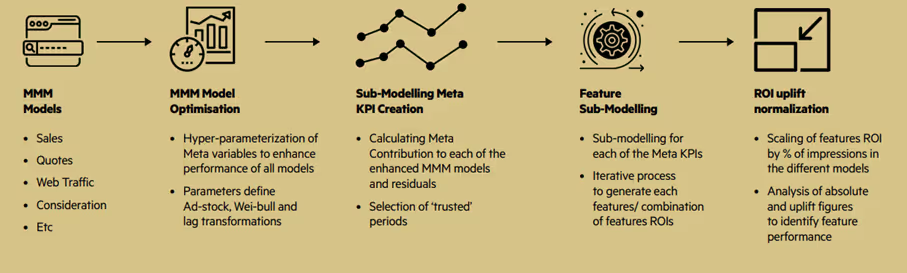
An optimized two-staged modelling approach was applied to existing MMM models developed by Ekimetrics for a range of brands, products and KPIs. First, the base models were optimized, and second, sub-models were created to explain the variation in Meta contribution using the creative features. Bayesian optimization was used in both steps for variable transformation in relation to lag, adstock and saturation.
Modelling workflow
The MMM models used in this analysis are multilinear regressions accounting for all significant factors driving the KPI (most commonly sales), including Social Media.
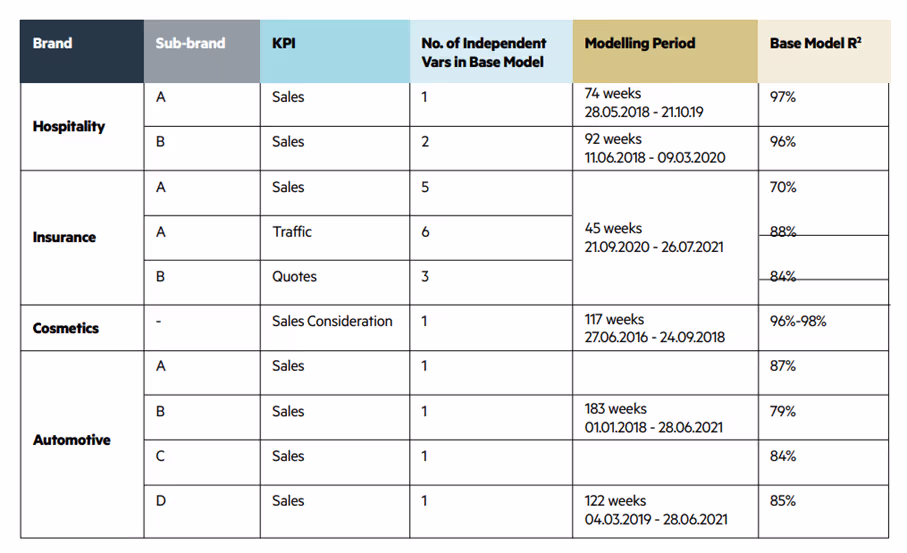
The selection of these models was based on the criteria of model stability (high R2, no autocorrelation, controlled heteroskedasticity) and enough variation in social activity (spend and impressions threshold of 5% per object). Some of the modelling periods were cut to account for sparse data, low correlation between creative impressions and modelled impressions or low variation. Therefore, a trusted relationship from social to the KPI of each MMM was established but could be enhanced by choosing more accurate parameterization of Meta activity through MMM model optimization. See the table below for more details about the models included in the study.
Detail of models selected
Once the MMM models were optimized, we isolated the impact of Meta on the KPI according to the following relationship:
Meta Contribution to KPI = Coefficient of Meta Variable x Transformed Meta Variable
The Meta contribution became the dependent variable of the Sub-Model, along with the constant and residuals. The object detection impressions timeseries served as the explanatory variables. The objective of this was to understand the impact of different feature splits into the overall Meta performance, allowing room for movement through the constant and residuals. A sub-modelling approach allowed for the object detection features to have indirect effects on the KPI, through the Meta variable. Bayesian Optimization Methods were employed to find the optimal transformations for each variable. Each Sub-model is a linear regression, testing the impact of the appearance of a feature, or feature group, and its opposite (partner feature) against the total Meta performance. Since the features are not mutually exclusive (between 48%-66% of creatives contained at least two objects), they could not all be tested in the same model.
Furthermore, the daily impressions and spend per feature were split according to creative type (static, carrousel or video). That is, the impressions associated with a feature or combination of features, e.g., Person & Product, were split out by static, video and carousel. While it was not in the scope of the study, doing this allowed for further analysis into the impact of features by creative type. A sequential approach was followed in which each feature group was tested in isolation. Within each sub-model, the transformations of the features (lag, adstock, and diminishing returns) which maximized R2, and minimized p-values were chosen. The transformations that the Meta features follow were bounded to the following ranges: lag of 0-3, adstock of 0-50, saturation (K; S) of 0.1-0.8; 1-9.
An example of sub-model is shown below.
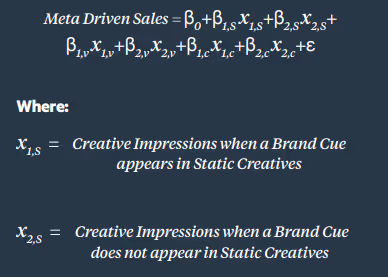
Same for Video (V) and Carousel (C)
One major challenge with the approach of testing the appearance of a feature or a set of features against its partner feature (e.g. impressions of creatives where a Brand Cue appears vs impressions of creatives where a Brand Cue does not appear), is that the partner feature is indirectly testing the appearance of other features or no features at all.
To manage the risk of results inaccuracy we made sure that:
- Both the main feature and the partner feature in the sub-models had to be statistically significant at a 10% level. For example, if the appearance of a feature is significant but the partner is not, the results of that regression were not used.
- The percent of Impressions of the feature being tested had to be > 5%
One last step: ROI calculation
The last step of the analysis centred around calculating ROIs and deriving ROI uplifts for each feature per brand, using the feature contributions from the sub-models and the associated spend.
This is used to:
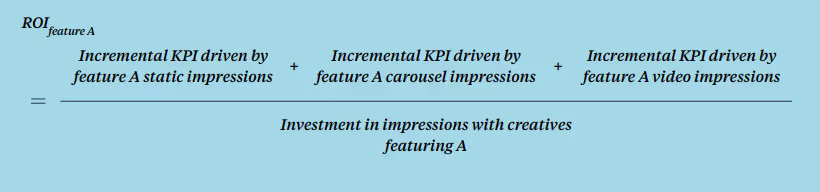
- Calculate the ROI of each feature (and partnering feature/s) using the contribution and the spend associated with that feature. Because the features were modelled by creative type (static, carousel, and video), the results were weighted by the percent of impressions each type represented over the total of the feature
- Calculate the ROI of the partnering variable (e.g. No Product)
- Calculate the Uplift
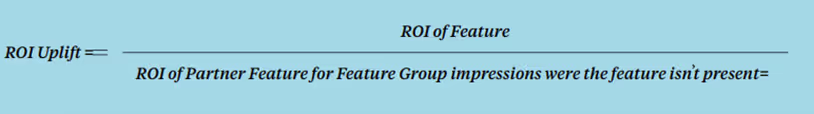
- Index and rank ROI uplifts
- ROI uplifts are standardized, so they are comparable across brands
- They are then ranked so that #1 is the feature with the greatest uplift (maximum difference between the feature appearing and not appearing)
Leveraging data effectively is complex and challenging
Thanks to this methodology, we were able to find the most important and efficient features for each brand. As previously mentioned, this methodology can be adapted to many different audiences and uses cases. But data experts and industry specialists are the only ones who can create the path for success.
Ekimetrics specializes in creating scalable data and analytics solutions that drive high-impact optimizations in alignment with overarching brand strategy.
If you want to have a straightforward conversation, contact Ekimetrics’ data experts today.