News, insights, and events
Your successes matter. As MMM and AI experts since 2006, we want to share our vision, learnings and showcase our clients’ achievements. Explore our clients’ stories, opinion papers, interviews, articles, and discover upcoming events.
Featured content

Thank you! Your submission has been received!
Oops! Something went wrong while submitting the form.


.png)
.png)


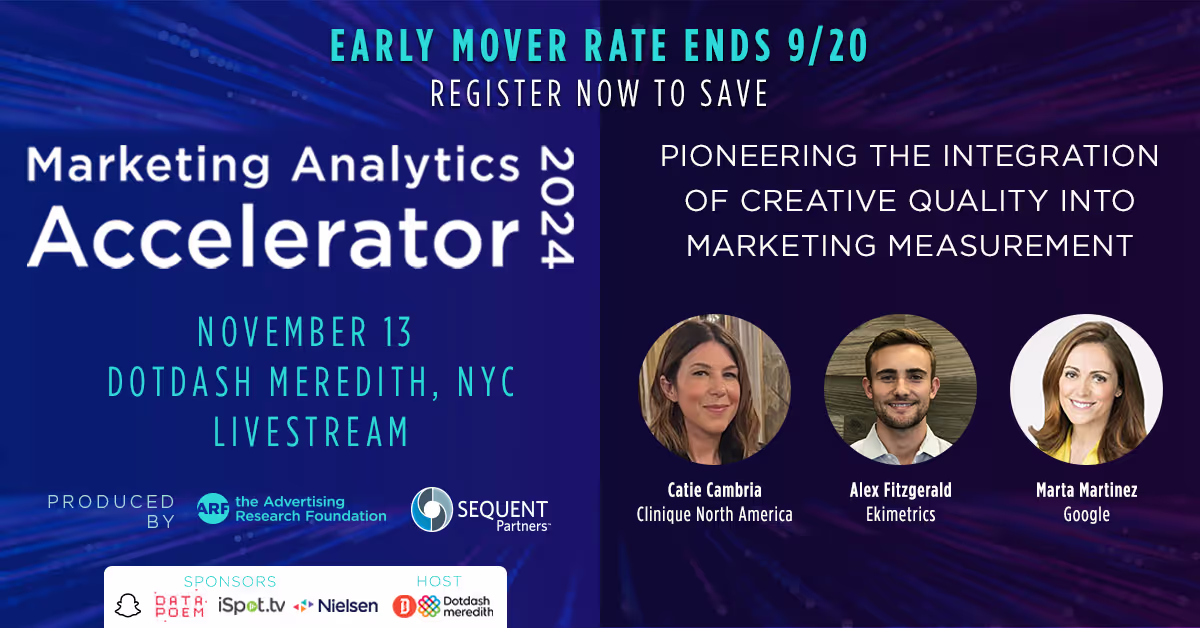
Upcoming Events
Hear our clients’ experiences, testimonials, and winning practices with AI, Generative AI, and Marketing Mix Modeling.

Get in touch
Connect with our Data Science experts
Oops! Something went wrong while submitting the form.